The MG3 is a supermini car produced by the Chinese automotive company SAIC under the British MG marque. The first generation, marketed as the MG3 SW, is based on the British-made Rover Streetwise, which itself was based on the Rover 25, while since the second generation, introduced in 2011 is marketed simply as the MG3.
MOT data from 21,084 tests puts this car on a 79.7% first-time pass rate, roughly in line with the UK fleet average. Average mileage at test is 35,568 miles. The most common fail item is tyre tread below the legal limit, followed by tyre with exposed cords.
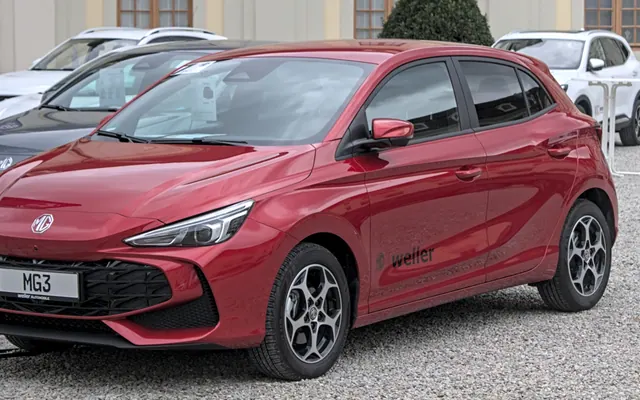
So much better than the car it replaced, the MG 3’s core appeal is its self-charging Hybrid+ drive system, although a cheaper, more conventional petrol-only model is also available. High levels of equipment are standard yet despite it being a big small car, it doesn’t feel especi.
Buyers weighing up a used 3 should treat the failure breakdown as a pre-purchase checklist. The pass rate is reasonable, but the gap between first attempt and a clean sheet narrows with age and mileage.