.JPG)
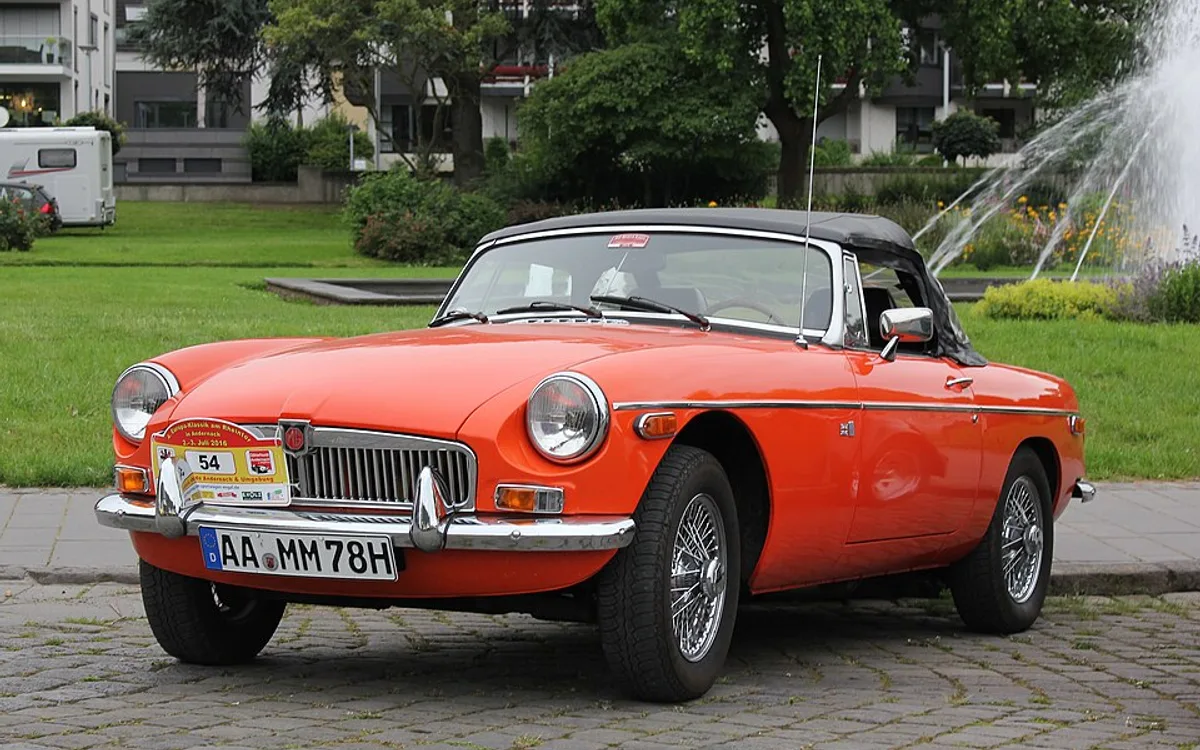
MG
B
4,131 MOT tests analysed. sits above the UK fleet average — here's where Bs pass, fail, and end up on the retest sheet.
That's 6.1 points above the UK fleet average across our 1,984 tracked models — a confident result.
Pass
83.6%
Pass-after-fix
2.4%
Fail
12.7%
Avg miles
43,054
Pass + Pass-after-fix + Fail = 100%
Trim variants
The picture
B: above-average pass rates, with caveats
Across 3,145 MOT tests, the B returns 80.6% first-time pass — above the UK fleet average. The single most-logged Major fail is emissions levels exceed default limits. Brakes imbalance across an axle such and a missing steering gaiter round out the top three. Average tested mileage sits at 43,923, which is the lens to read those failure rankings through. If you own one and the next test is close, the ranked list below is a sensible pre-test checklist.
ABI Insurance Group
Group 12–28
Below the fleet average — generally reasonable to insure. Lower groups cost less to insure; UK fleet average is around Group 22.
Source: ABI Group Rating Panel · administered by Thatcham Research · groups cover standard variants; performance trims may sit higher. Browse all insurance groups →
12–28
out of 50
Top ten reasons for rejection.
Filter failures:
Hide categories
Tick a category to hide it from rankings sitewide. Saved in this browser only.
- 01
Windscreen washers not working or not providing sufficient fluid to clear the windscreen
67 occurrences · 1.6% of tests
- 02
A lamp missing, inoperative or in the case of a multiple light source more than 1/2 not functioning
64 occurrences · 1.5% of tests
- 03
Emissions levels exceed default limits
64 occurrences · 1.5% of tests
- 04
Steering rack gaiter or ball joint dust cover missing or no longer prevents the ingress of dirt etc
49 occurrences · 1.2% of tests
- 05
A rear registration plate lamp or light source missing or inoperative in the case of multiple lamps or light sources
46 occurrences · 1.1% of tests
- 06
Audible warning inoperative
46 occurrences · 1.1% of tests
- 07
Steering rack gaiter or ball joint dust cover damaged or deteriorated
46 occurrences · 1.1% of tests
- 08
Brakes imbalance across an axle such that the braking effort from any wheel is less than 70% of the maximum effort recorded from the other wheel on the same axle.
42 occurrences · 1.0% of tests
- 09
Steering rack gaiter or ball joint dust cover damaged or deteriorated
37 occurrences · 0.9% of tests
- 10
Windscreen washers not working or not providing sufficient fluid to clear the windscreen
36 occurrences · 0.9% of tests
Counts cover Major and Dangerous defects logged at test. Advisory items excluded so this shows why a car was rejected, not just what the tester flagged in passing.
Worst-case fix budget · top 2 failures
£88–£275
If every one of this B's most-logged Major fails hit at the same MOT, that's the real-world UK garage range. Reality is usually one or two items, not all of them. Open the estimator →
Try the calculator
Build your own retest budget.
Tools that pre-empt a retest.
Picked against this car's top failure patterns. Affiliate links to Amazon UK — we earn a small cut at no cost to you. Disclosed up-front, doesn't shape the data.
My Motor World · affiliate
Parts & supplies for this fix
Affiliate links — small commission, no extra cost to you.

Summit
Summit ADRG-60 MG Replacement Stick-On Tinted Mirror Glass LHS
£7.69
View at My Motor World →

Autotek
Autotek Ford Nordic Blue 300ml
£14.29
View at My Motor World →

Motor World
Motor World MG Rover F 95-2002 Car Floor Mat Set
£32.99
View at My Motor World →
Motor World
Motor World Rover MGB Car Floor Mat Set
£32.99
View at My Motor World →
Click Mechanic · affiliate
Book a mobile mechanic
Affiliate links — small commission, no extra cost to you.
Mobile mechanic · UK-wide
Book a mechanic at your door.
Fixed-price quotes upfront. No garage needed. Click Mechanic sends a vetted local mechanic to you — home, work, or roadside.
Buying or keeping a B?
Use the failure ranking as a pre-test checklist or a haggling lever. Treat the headline pass rate as a fleet-wide trend, not a guarantee on any individual car.
If you own a B and your last MOT looked nothing like the ranked failures above, that's normal — individual cars vary widely. The ranking shows the patterns testers flag most often across the country.