Top 30
Cars with the worst UK MOT tyre failure rate
Sorted by total tyre-defect count divided by total tests. 1,000-test minimum.
- 01

 11.8%
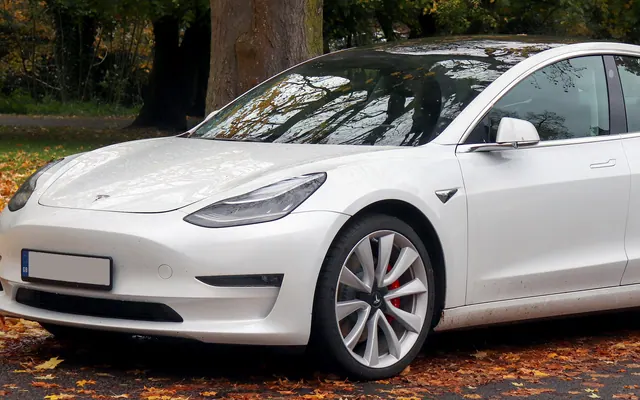
11.8%Tesla Model 3 Long Range Awd
67,261 tests · 41,943 avg mi · 87.3% pass
At #1, the Model 3 Long Range Awd records a 11.8% tyre-defect rate across a fleet averaging 42k miles at test. The specific tyre defects driving that figure are tyre tread under the limit and a tyre with the cords showing. A 87.3% first-time pass rate means tyres are the dominant weak point — fix those and the car's overall MOT record looks reasonable.
- 02
 11.6%
11.6%Tesla Model X Long Range Awd
3,424 tests · 45,322 avg mi · 85.8% pass
At #2, the Model X Long Range Awd records a 11.6% tyre-defect rate across a fleet averaging 45k miles at test. The specific tyre defects driving that figure are a tyre with the cords showing and tyre tread under the limit. A 85.8% first-time pass rate means tyres are the dominant weak point — fix those and the car's overall MOT record looks reasonable.
- 03
 11.1%
11.1%Tesla Model 3 Performance Awd
25,774 tests · 43,333 avg mi · 85.8% pass
At #3, the Model 3 Performance Awd records a 11.1% tyre-defect rate across a fleet averaging 43k miles at test. The specific tyre defects driving that figure are a tyre with the cords showing and a seriously damaged tyre. A 85.8% first-time pass rate means tyres are the dominant weak point — fix those and the car's overall MOT record looks reasonable.
- 04

 10.9%
10.9%Mercedes Benz Eqc 400 Amg Line Premium 4M
3,840 tests · 31,541 avg mi · 87.3% pass
At #4, the Eqc 400 Amg Line Premium 4M records a 10.9% tyre-defect rate across a fleet averaging 32k miles at test. The specific tyre defects driving that figure are a tyre with the cords showing and a seriously damaged tyre. A 87.3% first-time pass rate means tyres are the dominant weak point — fix those and the car's overall MOT record looks reasonable.
- 05

 10.9%
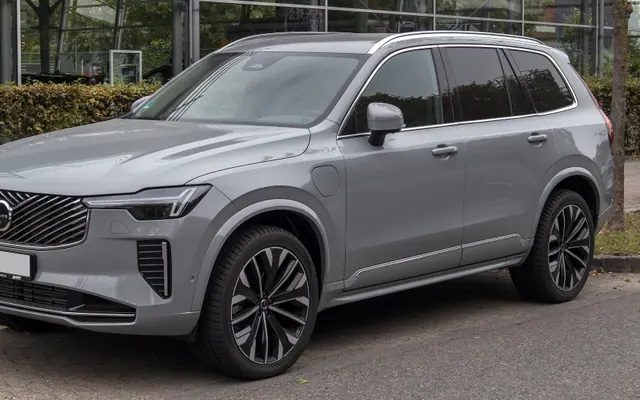
10.9%Volvo Xc90 Inscrp Pro T8rchrge Awd A
1,342 tests · 32,874 avg mi · 87.7% pass
At #5, the Xc90 Inscrp Pro T8rchrge Awd A records a 10.9% tyre-defect rate across a fleet averaging 33k miles at test. The specific tyre defects driving that figure are a seriously damaged tyre and a tyre with the cords showing. Owner-flagged: Owner reports (8 entries) flag recurring problems with battery/electrical, electrical faults, brake…
- 06
 10.8%
10.8%Tesla Model 3 Standard Range +
36,220 tests · 42,214 avg mi · 87.4% pass
At #6, the Model 3 Standard Range + records a 10.8% tyre-defect rate across a fleet averaging 42k miles at test. The specific tyre defects driving that figure are tyre tread under the limit and a tyre with the cords showing. A 87.4% first-time pass rate means tyres are the dominant weak point — fix those and the car's overall MOT record looks reasonable.
- 07

 10.3%
10.3%BMW X1 Xdrive25e Sport Auto
1,272 tests · 35,097 avg mi · 88.0% pass
At #7, the X1 Xdrive25e Sport Auto records a 10.3% tyre-defect rate across a fleet averaging 35k miles at test. The specific tyre defects driving that figure are a seriously damaged tyre and a tyre with the cords showing. A 88.0% first-time pass rate means tyres are the dominant weak point — fix those and the car's overall MOT record looks reasonable.
- 08

 10.2%
10.2%Volkswagen Id4 1st Edition
4,243 tests · 34,580 avg mi · 87.2% pass
At #8, the Id4 1st Edition records a 10.2% tyre-defect rate across a fleet averaging 35k miles at test. The specific tyre defects driving that figure are a tyre with the cords showing and a seriously damaged tyre. A 87.2% first-time pass rate means tyres are the dominant weak point — fix those and the car's overall MOT record looks reasonable.
- 09 9.7%
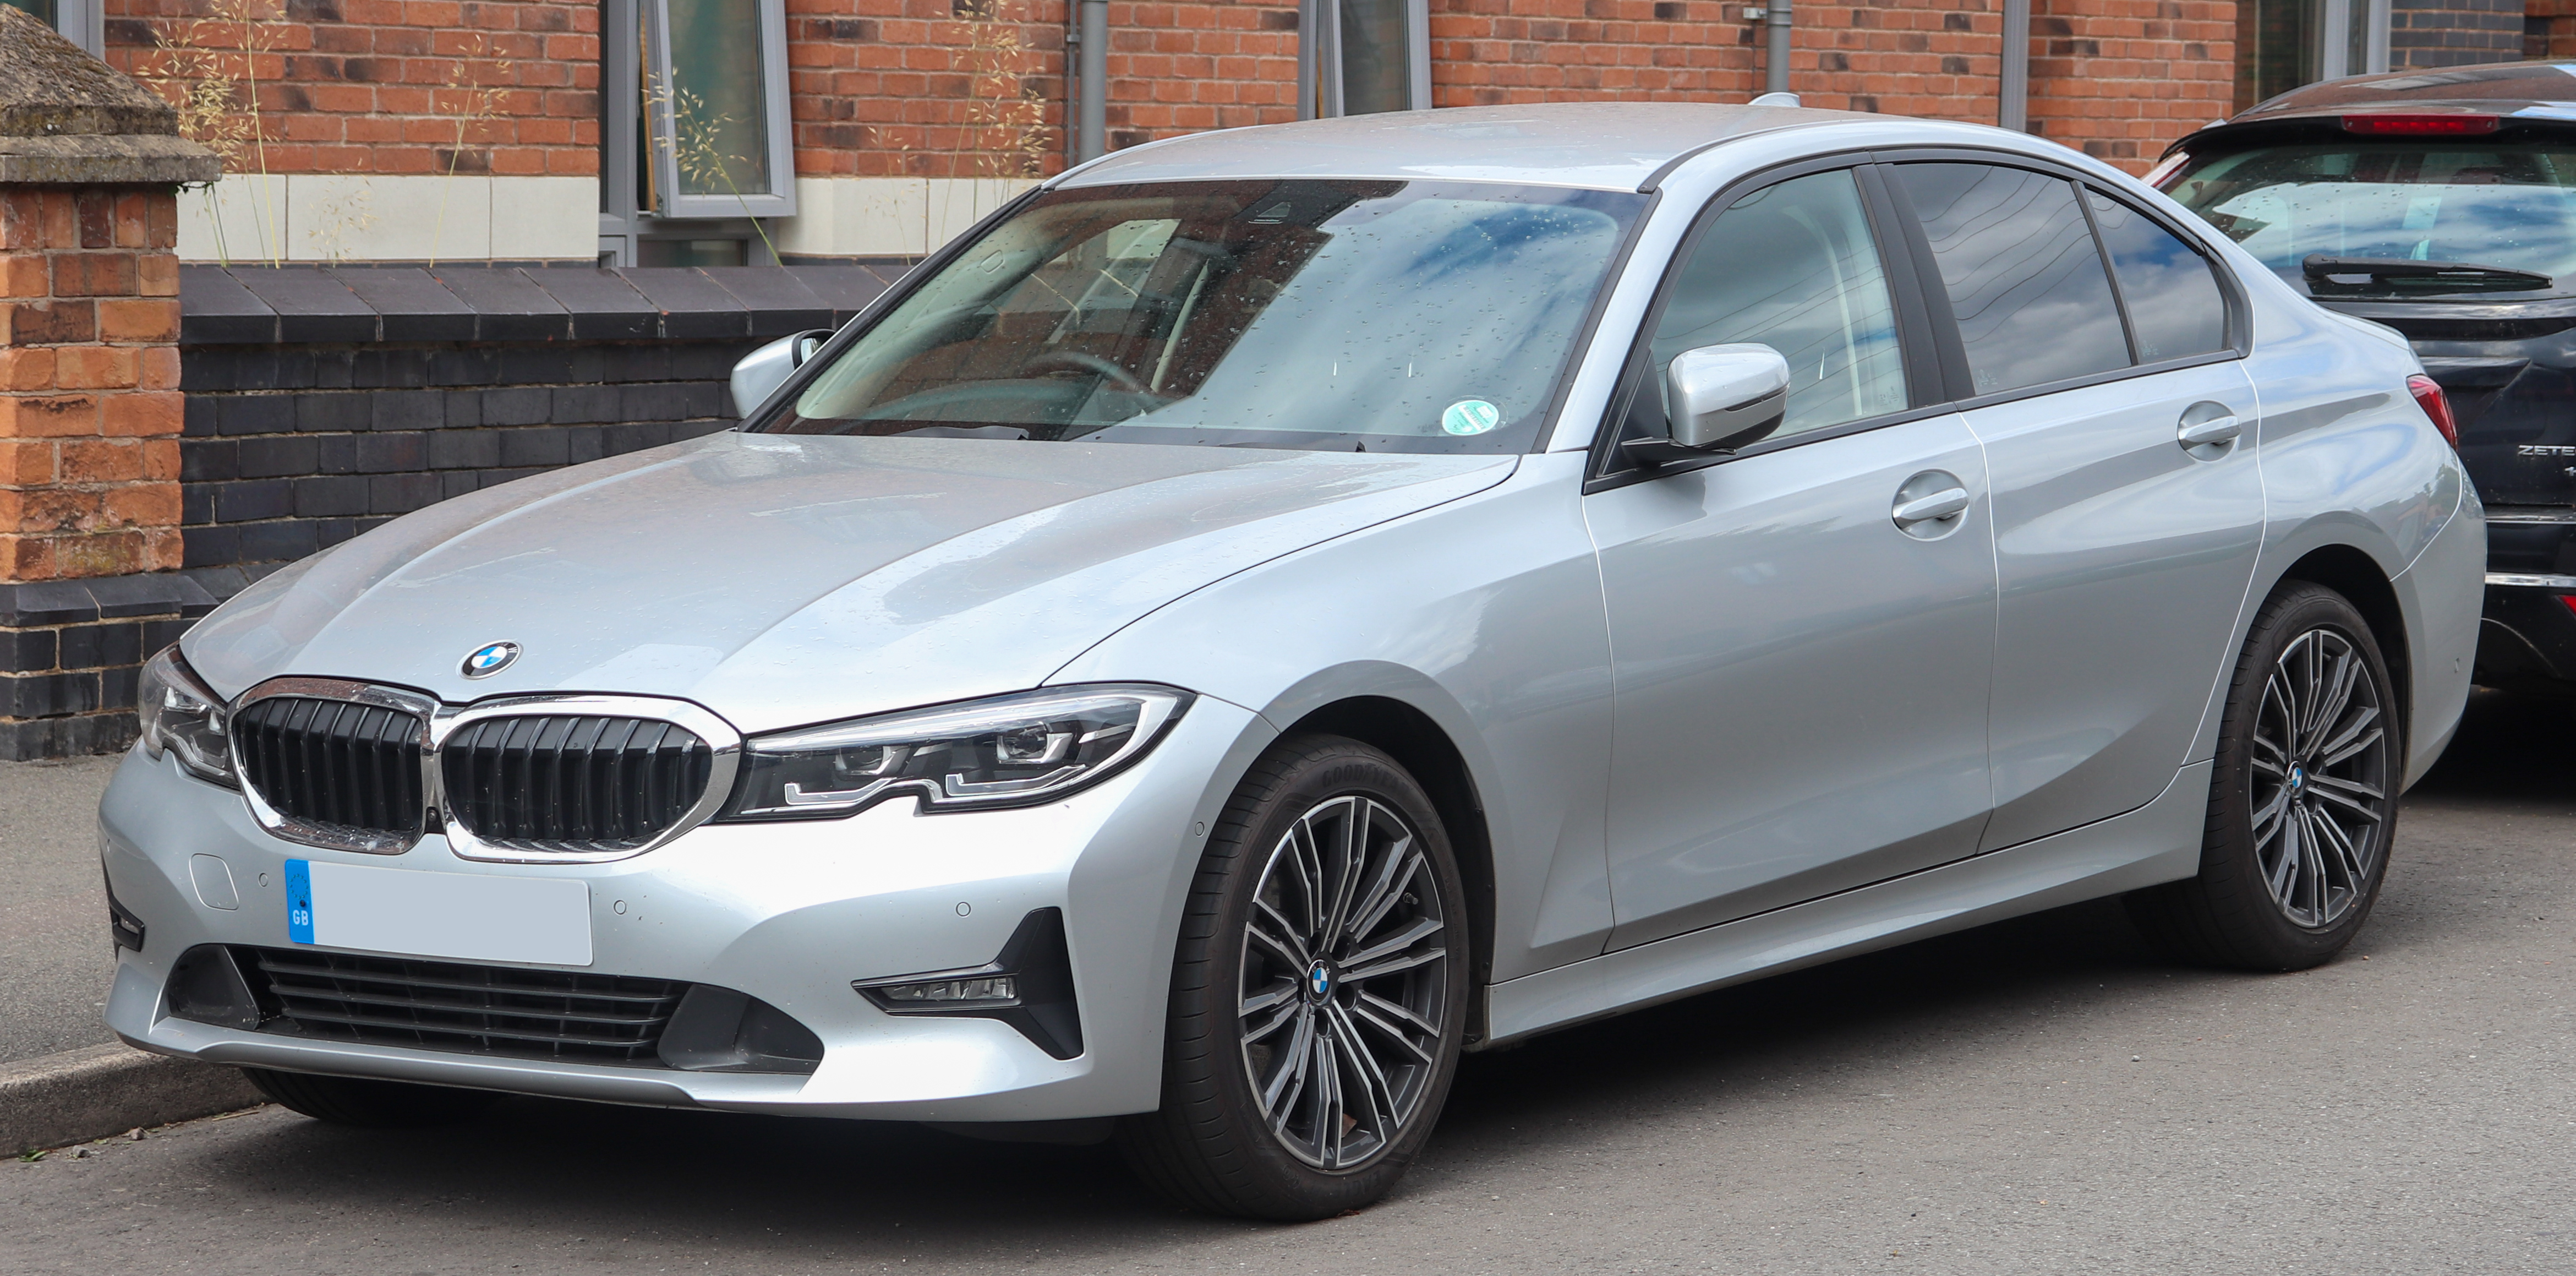
BMW 330e M Sport Pro Edition Auto
1,990 tests · 42,102 avg mi · 86.2% pass
At #9, the 330e M Sport Pro Edition Auto records a 9.7% tyre-defect rate across a fleet averaging 42k miles at test. The specific tyre defects driving that figure are a seriously damaged tyre and a seriously damaged tyre. A 86.2% first-time pass rate means tyres are the dominant weak point — fix those and the car's overall MOT record looks reasonable.
- 10
 9.6%
9.6%BMW X5 Xdrive45e M Sport Auto
11,263 tests · 39,975 avg mi · 87.9% pass
At #10, the X5 Xdrive45e M Sport Auto records a 9.6% tyre-defect rate across a fleet averaging 40k miles at test. The specific tyre defects driving that figure are a seriously damaged tyre and a tyre with the cords showing. A 87.9% first-time pass rate means tyres are the dominant weak point — fix those and the car's overall MOT record looks reasonable.
- 11
 9.6%
9.6%Tesla Model 3
2,234 tests · 48,872 avg mi · 89.1% pass
At #11, the Model 3 records a 9.6% tyre-defect rate across a fleet averaging 49k miles at test. The specific tyre defects driving that figure are tyre tread under the limit and a seriously damaged tyre. A 89.1% first-time pass rate means tyres are the dominant weak point — fix those and the car's overall MOT record looks reasonable.
- 12

 9.6%
9.6%Audi A3 E Tron 40 S A
1,902 tests · 38,459 avg mi · 85.9% pass
At #12, the A3 E Tron 40 S A records a 9.6% tyre-defect rate across a fleet averaging 38k miles at test. The specific tyre defects driving that figure are a tyre with the cords showing and a seriously damaged tyre. Owner-flagged: Report of battery cut out on 2021 Audi A3 1.5 TSI. Dealer…
- 13

 9.4%
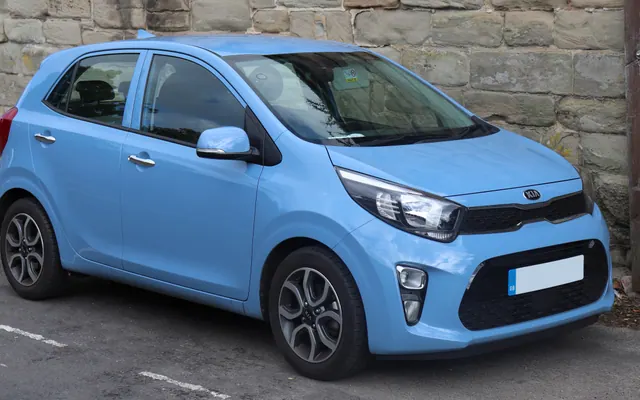
9.4%Kia Picanto GT Line S Isg
1,658 tests · 17,587 avg mi · 88.0% pass
At #13, the Picanto GT Line S Isg records a 9.4% tyre-defect rate across a fleet averaging 18k miles at test. The specific tyre defects driving that figure are a seriously damaged tyre and a seriously damaged tyre. Owner-flagged: The Kia Picanto continues to offer a fun and affordable option in…
- 14
 9.3%
9.3%Tesla Model X Perform Ludicrous Awd
1,372 tests · 44,213 avg mi · 88.5% pass
At #14, the Model X Perform Ludicrous Awd records a 9.3% tyre-defect rate across a fleet averaging 44k miles at test. The specific tyre defects driving that figure are a tyre with the cords showing and tyre tread under the limit. A 88.5% first-time pass rate means tyres are the dominant weak point — fix those and the car's overall MOT record looks reasonable.
- 15
 9.0%
9.0%Audi A3 Sport 40 Tfsi E S A
4,156 tests · 33,829 avg mi · 88.6% pass
At #15, the A3 Sport 40 Tfsi E S A records a 9.0% tyre-defect rate across a fleet averaging 34k miles at test. The specific tyre defects driving that figure are a seriously damaged tyre and a tyre with the cords showing. Owner-flagged: Report of battery cut out on 2021 Audi A3 1.5 TSI. Dealer…
- 16
 8.9%
8.9%Tesla Model X
9,909 tests · 64,053 avg mi · 85.6% pass
At #16, the Model X records a 8.9% tyre-defect rate across a fleet averaging 64k miles at test. The specific tyre defects driving that figure are a tyre with the cords showing and tyre tread under the limit. A 85.6% first-time pass rate means tyres are the dominant weak point — fix those and the car's overall MOT record looks reasonable.
- 17 8.9%
Volvo Xc90 R Design T8 Rcharge Awd A
1,391 tests · 35,528 avg mi · 89.9% pass
At #17, the Xc90 R Design T8 Rcharge Awd A records a 8.9% tyre-defect rate across a fleet averaging 36k miles at test. The specific tyre defects driving that figure are a seriously damaged tyre and a tyre with the cords showing. Owner-flagged: Owner reports (8 entries) flag recurring problems with battery/electrical, electrical faults, brake…
- 18 8.9%
Mercedes Benz E 400 Amg LN Ngt ED Prm+d 4M A
1,387 tests · 36,393 avg mi · 84.1% pass
At #18, the E 400 Amg LN Ngt ED Prm+d 4M A records a 8.9% tyre-defect rate across a fleet averaging 36k miles at test. The specific tyre defects driving that figure are a seriously damaged tyre and a seriously damaged tyre. Owner-flagged: Report of AdBlue system failure on 2016 E220d at 38,250 miles. AdBlue…
- 19 8.7%
Volvo Xc90 Inscription B5 Mhev Awd A
1,431 tests · 34,684 avg mi · 88.8% pass
At #19, the Xc90 Inscription B5 Mhev Awd A records a 8.7% tyre-defect rate across a fleet averaging 35k miles at test. The specific tyre defects driving that figure are a tyre with the cords showing and a seriously damaged tyre. Owner-flagged: Owner reports (8 entries) flag recurring problems with battery/electrical, electrical faults, brake…
- 20
 8.7%
8.7%Kia Proceed GT Line S Isg S A
1,268 tests · 32,611 avg mi · 86.6% pass
At #20, the Proceed GT Line S Isg S A records a 8.7% tyre-defect rate across a fleet averaging 33k miles at test. The specific tyre defects driving that figure are a tyre with the cords showing and a seriously damaged tyre. A 86.6% first-time pass rate means tyres are the dominant weak point — fix those and the car's overall MOT record looks reasonable.
- 21

 8.6%
8.6%Nissan E Nv200
9,681 tests · 32,369 avg mi · 78.3% pass
At #21, the E Nv200 records a 8.6% tyre-defect rate across a fleet averaging 32k miles at test. The specific tyre defects driving that figure are a seriously damaged tyre and A tyre pressure monitoring system malfunctioning or obviously inoperative. A 78.3% first-time pass rate means tyres are the dominant weak point — fix those and the car's overall MOT record looks reasonable.
- 22
 8.6%
8.6%Volvo Xc60 Inscrp Pro T8rechrg Awd A
1,279 tests · 28,871 avg mi · 87.6% pass
At #22, the Xc60 Inscrp Pro T8rechrg Awd A records a 8.6% tyre-defect rate across a fleet averaging 29k miles at test. The specific tyre defects driving that figure are a seriously damaged tyre and a tyre with the cords showing. Owner-flagged: Owner reports (3 entries) flag recurring problems with AdBlue.
- 23
 8.5%
8.5%Isuzu Trucks Grafter N35.150
1,729 tests · 93,268 avg mi · 72.1% pass
At #23, the Grafter N35.150 records a 8.5% tyre-defect rate across a fleet averaging 93k miles at test. The specific tyre defects driving that figure are tyre tread under the limit and a seriously damaged tyre. A 72.1% first-time pass rate means tyres are the dominant weak point — fix those and the car's overall MOT record looks reasonable.
- 24 8.5%
Mercedes Benz C 220 Amg Line Ngt ED Prem D A
1,336 tests · 31,061 avg mi · 89.2% pass
At #24, the C 220 Amg Line Ngt ED Prem D A records a 8.5% tyre-defect rate across a fleet averaging 31k miles at test. The specific tyre defects driving that figure are tyre tread under the limit and a tyre with the cords showing. Owner-flagged: C220 CDI with automatic gearbox is disappointing. Surprising quality issues with pre-facelift…
- 25
 8.4%
8.4%Audi A4 S LN Black ED 35tdi Mhev SA
1,539 tests · 36,588 avg mi · 89.6% pass
At #25, the A4 S LN Black ED 35tdi Mhev SA records a 8.4% tyre-defect rate across a fleet averaging 37k miles at test. The specific tyre defects driving that figure are tyre tread under the limit and a tyre with the cords showing. Owner-flagged: Adblue module control unit failure reported on 2016 Audi A4 Avant Ultra…
- 26
 8.3%
8.3%BMW X7
3,451 tests · 43,224 avg mi · 88.2% pass
At #26, the X7 records a 8.3% tyre-defect rate across a fleet averaging 43k miles at test. The specific tyre defects driving that figure are a seriously damaged tyre and a tyre with the cords showing. A 88.2% first-time pass rate means tyres are the dominant weak point — fix those and the car's overall MOT record looks reasonable.
- 27 8.3%
Audi A3 S Line 40 Tfsi E S A
6,357 tests · 32,892 avg mi · 89.8% pass
At #27, the A3 S Line 40 Tfsi E S A records a 8.3% tyre-defect rate across a fleet averaging 33k miles at test. The specific tyre defects driving that figure are a seriously damaged tyre and a tyre with the cords showing. Owner-flagged: Report of battery cut out on 2021 Audi A3 1.5 TSI. Dealer…
- 28
 8.3%
8.3%BMW 330e M Sport Auto
15,931 tests · 43,958 avg mi · 87.1% pass
At #28, the 330e M Sport Auto records a 8.3% tyre-defect rate across a fleet averaging 44k miles at test. The specific tyre defects driving that figure are a seriously damaged tyre and a seriously damaged tyre. A 87.1% first-time pass rate means tyres are the dominant weak point — fix those and the car's overall MOT record looks reasonable.
- 29 8.1%
BMW Ix3 Premier Edition Pro
1,789 tests · 30,944 avg mi · 88.2% pass
At #29, the Ix3 Premier Edition Pro records a 8.1% tyre-defect rate across a fleet averaging 31k miles at test. The specific tyre defects driving that figure are a seriously damaged tyre and a tyre with the cords showing. A 88.2% first-time pass rate means tyres are the dominant weak point — fix those and the car's overall MOT record looks reasonable.
- 30
 8.1%
8.1%Tesla Model S
19,518 tests · 82,260 avg mi · 84.2% pass
At #30, the Model S records a 8.1% tyre-defect rate across a fleet averaging 82k miles at test. The specific tyre defects driving that figure are tyre tread under the limit and a tyre with the cords showing. Owner-flagged: More than just a car the Tesla Model S is a revolution,…
Tyres UK · affiliate
Where to buy replacement tyres
Affiliate links — small commission, no extra cost to you.


Click Mechanic · affiliate
Book a mobile mechanic
Affiliate links — small commission, no extra cost to you.
Mobile mechanic · UK-wide
Book a mechanic at your door.
Fixed-price quotes upfront. No garage needed. Click Mechanic sends a vetted local mechanic to you — home, work, or roadside.